How this was made
Drawing downtown Toronto for about $80
Someone asked me on X how I'm doing this, because fine-tuning a model to their style for Warsaw cost them about $100 and it stopped improving. Here is the whole answer: the models, what each step cost, and why it didn't take hundreds of dollars. The method is Tiny London's, by Boris Starkov. I followed it closely.
The short answer
- Teacher
- Gemini 3 Pro Image (Nano Banana Pro). It redrew a few hundred 1024 px renders of the city as illustrations. Those became the training targets.
- Student (base model)
- Qwen-Image-2.1-Turbo in edit mode, with a rank-32 LoRA trained with ai-toolkit on one rented H100 (RunPod). Input: the render. Output: the teacher's drawing of it.
- Generation
- On my laptop (M5 Pro, 48 GB) with mflux, 8 steps. The whole downtown map is denoised as one latent, so there are no tiles to stitch.
- Cost
- $91.97 in paid calls so far: $58.41 of Gemini and $33.56 of RunPod. The downtown core was drawn for free in 5 h 08 min on the laptop; the rest of the old City of Toronto on a rented H100 for $10.02.

What it cost
Every paid call went through a hard cap: a dollar cap in my own scripts, and prepaid credit on both Google AI Studio and RunPod, so a runaway stops when the credit does. These are the totals from the ledgers.
| Step | What it bought | Cost |
|---|---|---|
| Style tests | 14 Gemini calls while I was still choosing a look | $1.83 |
| Teacher pilot | 56 images at the standard price, to test the prompt and the checks. One call cost $1.50 (below) | $9.26 |
| Teacher training set | 484 calls through the Gemini Batch API at half price, for 344 accepted pairs. At the standard price: $74.58 | $37.29 |
| Signs set | 142 Batch calls for 56 targets that keep real signs, for the second LoRA | $10.04 |
| Gemini, in all | $58.41 | |
| LoRA v1 | The training pod, 2 h 25 min on a Secure H100 SXM at $3.99/h: $9.72. The other $3.72 went on smoke tests and failed tries before it | $13.44 |
| LoRA v2 (the one the map uses) | 3,000 steps on the signs set, pod 1 h 50 min | $7.33 |
| H100 inference test | One downtown block on a rented H100, to price the rest of the city. Not used for the map | $0.54 |
| The old City of Toronto | 55 blocks around the core on one Secure H100 SXM, 2 h 10 min: $8.73. The other $1.29 went on three tries before it that failed or that I stopped | $10.02 |
| Repairs for it | Two short pods for the local re-draws: the seams along the core's edge and the lakeshore, marinas and tanks the flat-water rule had erased | $2.23 |
| RunPod, in all | $45.00 of prepaid credit, $11.44 left | $33.56 |
| Free or local | Generating the map (laptop), the renders and browser checks (my Mac mini), every check, the pixel-art layer, the traffic, hosting on Cloudflare's free tiers | $0 |
| Total | $91.97 |
Rows are rounded to the cent; the totals come from the unrounded ledgers. The style tests and the teacher pilot ran at the standard price. The training set and the signs set went through the Batch API, which billed $0.070–0.072 for a typical call against $0.141.
Why it didn't take hundreds of dollars
The LoRA never had to work out what Toronto looks like or where anything goes. By the time it trained, the geometry was fixed by the camera, the style was fixed by the teacher, and bad targets had been thrown out. It only had to copy a drawing technique. And the part that usually eats retries, keeping the whole map consistent, isn't a training problem at all.
1. Pairs that line up pixel for pixel
Every render comes from one orthographic camera, 30° down and turned to Toronto's street grid, moved by whole pixels. The teacher draws over the render, so each target sits exactly on its input: in the pilot, all 56 teacher images had a shift of 0 px and a zoom of 1.00. Training in edit mode on those pairs means the LoRA learns style, not layout.
Base Qwen-Image-2.1-Turbo already had an illustrated look on low-rise, park and water frames. Its real fault was moving the whole drawing by 4–9 px, and that followed the noise seed, so no prompt could fix it. After 1,500 steps every LoRA checkpoint sat on the render at 0 px, where base Turbo was off by 2.1 px on average (up to 8).
2. A strong teacher, and checks that throw out bad targets
Gemini 3 Pro Image is good at one frame and bad at consistency between frames. For training pairs that doesn't matter. The prompt puts fidelity first (draw exactly what the render shows, add and remove nothing), then describes how to draw, never what: flat cel-shaded colour, crisp dark outlines, a 1990s city-builder homage. Tiny London found that every noun in a prompt ends up somewhere it doesn't belong, and I saw the same thing in my early tests.
Then free automatic checks compare every attempt with ground truth: the render for structure, Google's own depth for outlines, the City's water polygons for water, OCR for lettering, and each building's colour. Anything that fails is redrawn, up to 3 tries, then dropped. On the 56 pilot images the final checks agreed with my eye on 54. In the training set it took 1.35 calls per accepted pair, and 13 targets were dropped. I looked at contact sheets of the rejects, but nothing was hand-labelled.
3. A few hundred pairs, not thousands
The first set was 344 pairs: 327 to train on, 17 held out. Water, parks, the islands, ravines and low-rise streets outside the core balance the downtown towers. Tiny London's teacher redrew about 2,500 frames, for 6,326 training examples. Isometric NYC used about 40 pairs. Because the pairs are registered and the targets are clean, a few hundred was enough. LoRA v1 trained 5,000 steps in 1 h 59 min.
4. The Turbo training adapter keeps 8-step sampling
Turbo is a distilled model that samples in 8 steps without guidance. ai-toolkit trains it through ostris's training adapter, a LoRA that is on during training and off while sampling, so the distillation survives. The result: about 45 s a frame on the laptop. That made it free to test every checkpoint on the held-out frames at home instead of on rented time.
5. An earlier checkpoint beat the last one
Checkpoints were saved every 500 steps and copied home as they appeared. For v1, step 3,000 had the closest colour and greens to the teacher; by step 5,000 the greens drifted paler and hazier, a first sign of overfitting. For v2, step 2,500 beat step 3,000, which drifted darker in the greens. If your results stop improving, the answer may already be in an earlier checkpoint. More steps made mine worse.
6. Consistency comes from the sampler, not from more training
Tiny London's key finding: seams are a sampling problem. A model drawing one tile at a time is a slightly different artist every time. So the whole map is one latent. Every step runs the model on 1024 px windows 768 px apart; alternate steps use a second grid shifted by 384 px, and the overlapping predictions are blended so no window edge survives. The core needed 253 windows on one grid and 211 on the other, in 8 blocks.
Blocks are pinned: a new block holds the finished blocks next to it fixed at every step, redraws a 256 px strip of them and blends over it. On the same test block, drawing frame by frame flagged 11.7% of the cut lines as seams; joint sampling flagged 1.4%, the render's own rate. Across the core's 10 block joins I can't find one at 1:1.


What went wrong
- The $1.50 call. One pilot call came back with 11 images and billed $1.50, about 11 times a normal call. With $0.74 left of the $10 I had approved, I stopped and ran no retries. Every call now caps its output, but in the Batch run 13 calls (2.7%) still returned 3–5 images, $4.04 between them.
- 15 hours of "no instances". RunPod refused every pod request for about 15 hours. The cause was my own request: it asked for CUDA "13.0" exactly, and every H100 in stock reported 13.2. Before that, smoke runs failed on a blocked User-Agent, a web UI that took the container down with it, and an offline model lookup. Those smoke runs and failed tries cost $3.72 before the real run.
- Darker joint blocks. Sampling the map as one latent came out darker than drawing the same windows alone, and more so as the canvas grew (Oklab L 0.559 against 0.585). The fix is one global tone match, calibrated on 12 windows generated alone. It is one function of the colour applied everywhere, so it can't make a seam.
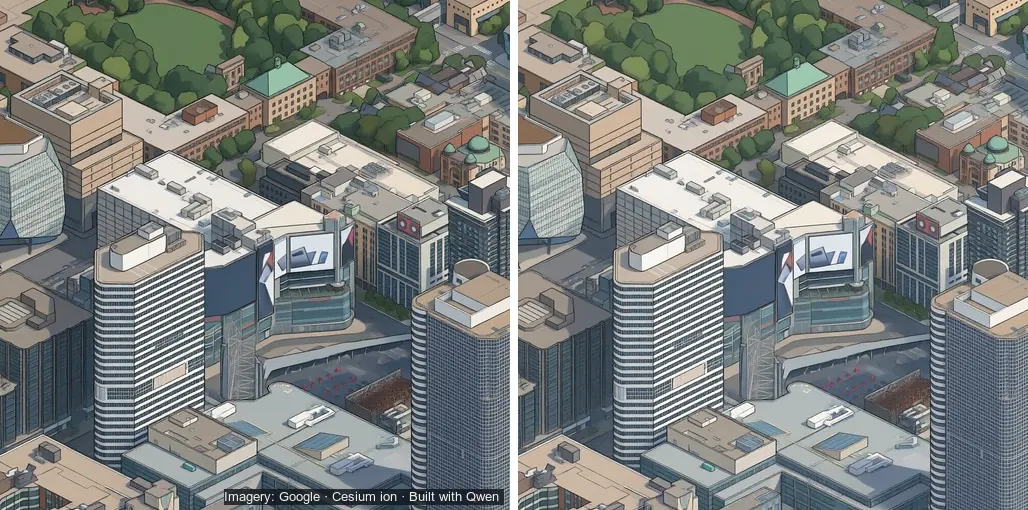
- Garbled small signs. The first LoRA painted every sign out, because the teacher prompt asked for no text. The signs set taught v2 to keep real signs: SHERATON, KPMG, TRIDEL and CANADA MALTING come through clean. Small lettering doesn't. Of 22 sign frames in the core, 5 kept their sign, 5 came out garbled (pwc reads as "pure") and 12 were drawn plain or unreadable.
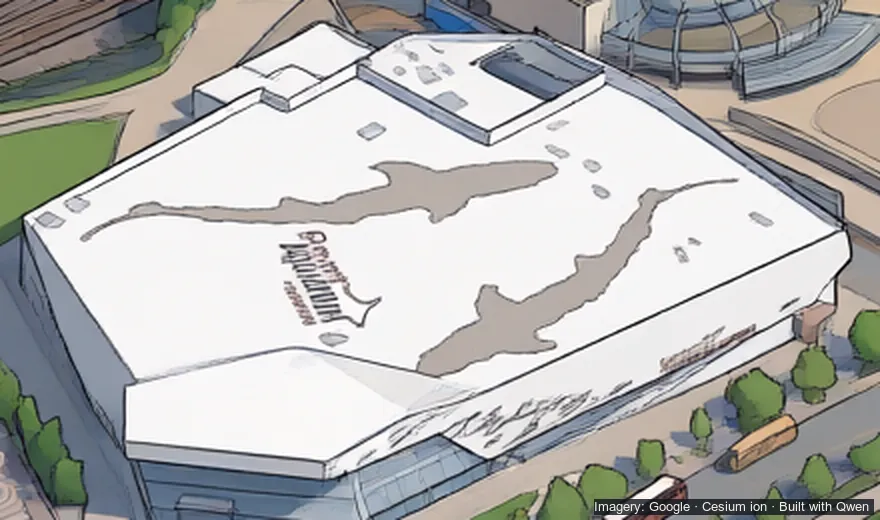
- Things on the water. A data check over the whole map flagged 37 spots. Nearly all were real boats, docks and shorelines a few pixels off the City data, but two objects on open water were the model's own: a small hull and a sailboat drawn bigger than the dot in the render.
If you're trying this in another city
- Get the camera right first. Pixel-registered pairs did more for me than anything in training.
- Write the prompt as drawing technique, with no nouns for things that might not be in the frame.
- Check every teacher output against data you trust before it goes into training.
- Hold out a few frames, save checkpoints often, and compare them on those frames. Pick by eye and by numbers, not by the last step.
- Pay a dollar or two for a short smoke run before the real one, and keep prepaid credit as a hard cap.
- Spend on the sampler, not on more training, if the problem is consistency across the map.
Deep zoom turns into pixel art
Magnified past about 2×, a diffusion drawing shows wobbly outlines and smeared detail. I'd rather it turned into pixel art than into AI-upscaled wavy lines. So from 1.75× the map fades into a pixel-art layer, fully there by 2×: one art pixel for every 2 × 2 map pixels (0.46 m), one 256-colour palette for the whole map, and a light ordered dither, drawn with hard square pixels up to the 8× maximum. It takes 10.4 s of laptop CPU to make for the whole core. I tried upscalers first. They made the wavy outlines crisp wavy outlines.
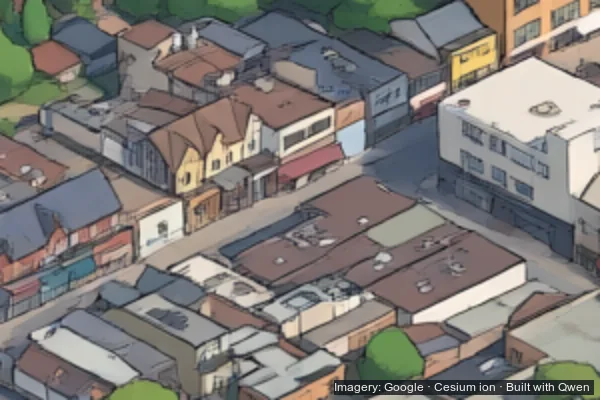
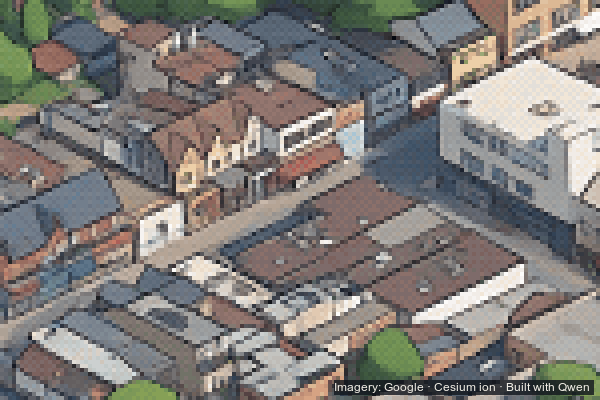
Kensington Market. Imagery: Google · Cesium ion · Built with Qwen
Traffic
Zoom in and small pixel-art cars drive the real streets, with red TTC streetcars on their tracks. The streets, signals and tracks are OpenStreetMap's, as Slop Toronto prepared them, and the traffic volumes and turning shares are the City of Toronto's counts. Cars follow lanes and one-way streets and stop at the lights; streetcars dwell at the real stops. Every sprite pixel is tested against a mask built from Google's depth, so cars go behind buildings, trees and the Gardiner's deck. It held 60 fps on desktop and phone in my checks.
What's next
Clickable buildings, from the building IDs in Slop Toronto's open data, and then more of the city. The H100 test put the whole City of Toronto at about 12.9 H100-hours, about $35 at RunPod's Community price, though it would need more teacher frames for the suburbs first.
Credit where it's due
Tiny London by Boris Starkov worked out this method: the Gemini teacher with checks, the Qwen-Image-2.1-Turbo LoRA, joint sampling with pinned blocks. Their write-up is the reason this cost about $80 and not a lot more. Read it.
Isometric NYC by Andy Coenen came first, and Tiny London built on it.
The 3D city is Google's Photorealistic 3D Tiles, streamed through Cesium ion. The open data (buildings, water, parks, trees, streets, traffic counts, lidar) is the City of Toronto's, Ontario's and OpenStreetMap's, assembled for Slop Toronto.